Comparable Companies Analysis
Comparable Companies Analysis, often referred to as “Comps,” is a relative valuation method that involves assessing the value of a company by benchmarking it against a group of similar, publicly traded peers. The core idea is that businesses operating in the same industry, with similar financial and operational characteristics, should be valued in a comparable way by the market.
Comps are widely used in Mergers & Acquisitions (M&A) to determine a fair market value during negotiations, and in Initial Public Offerings (IPOs) to help set an appropriate listing price. They are especially valuable in fast-moving or opaque markets, where a data-driven reference to public market sentiment is crucial.
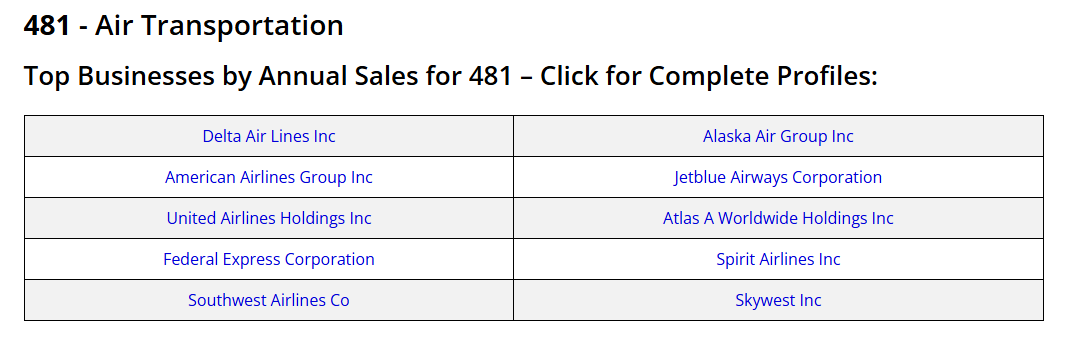
This guide provides an example of a Comparable Companies (‘Comps’) Analysis using Delta Air Lines as the target company.
Step 1. Define the Peer Group
In order to perform a reliable Comparable Companies Analysis, it is essential that investors carefully select the companies that will serve as benchmarks for the target firm. The investor typically begins by identifying a broad universe of potential peer companies, which is then systematically narrowed down based on specific financial and operational criteria before conducting the full analysis. Industry classification systems such as NAICS (North American Industry Classification System) and SIC (Standard Industrial Classification) codes serve as effective tools for establishing an initial list of relevant competitors within the same sector. Equity research reports are also helpful as they provide additional comments on relevant features such as non-recurring items.
Peer Group Selection Criteria:
- Business Characteristics: Similarities in product or service offerings, target customer segments, geographical markets and overall business model.
- Financial Profile: Comparable revenue growth rates, operating margins, EBITDA margins, and size.
Naics and SIC codes are useful for investors when deciding the competitors of their target firm and below investors can find an example following the Delta Air Lines analysis.
Step 2. Find and Analyze the Necessary Financial Information
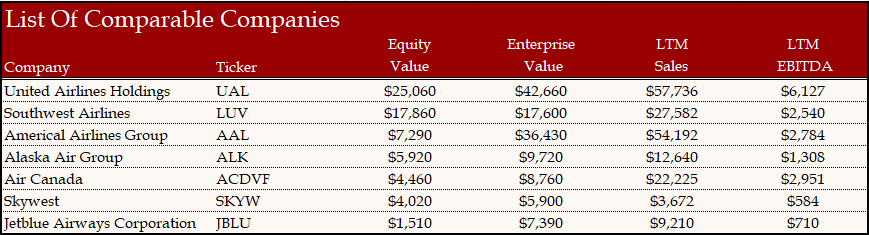
Once the comparable companies are selected, investors gather the necessary financial data to begin the analysis. This information is typically sourced from regulatory filings, such as the SEC’s 10-K annual reports and 10-Q quarterly reports. With these reports investors will calculate financial metrics and ratios to determine a value range of the target.
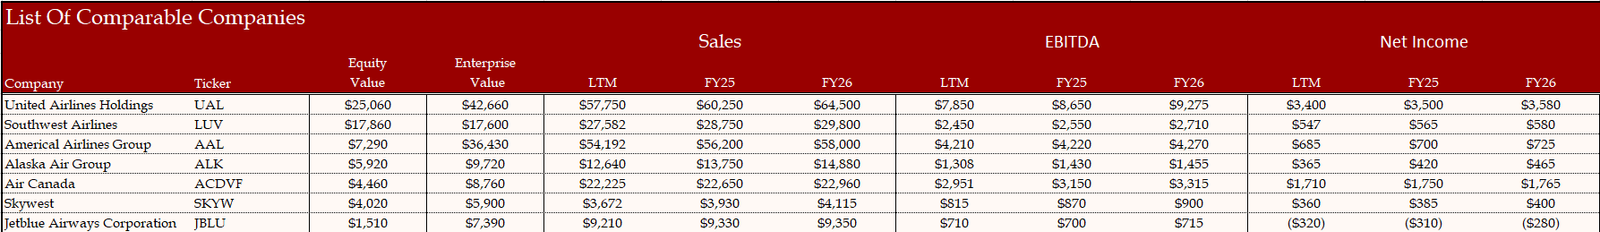
The key metrics analyzed include market valuation measures such as equity value and enterprise value, alongside income statement figures like EBITDA and net income. It is important for investors to make the necessary adjustments to these metrics, taking into account non-recurring items and aligning financial periods to ensure comparability. To calculate LTM (Last Twelve Months) financial data, investors should use the following formula:
LTM = Prior Fiscal Year + Current Year-to-Date Period – Prior Year-to-Date Period
Investors should be aware that companies may report their financial results based on differing fiscal year-ends—for example, April 30 rather than December 31. For solving this, investors adjust the data obtained from financial statements in order to compute for the same period. This process is known as calendarization.

A company with a fiscal year ending the 31st of March will use 3 as the month in the formula above.
Step 3. Calculate Peer Group Multiples
With the data, investors proceed to calculate valuation multiples for the comparable companies which is a process known as benchmarking. This step enables a direct comparison of the target’s financial and market performance relative to its peers, highlighting strengths and weaknesses in areas such as profitability, growth, and capital structure.
Key differences in metrics like profitability margins and leverage ratios are carefully analyzed to understand how the target stands out or falls behind its comparables. During this stage, trading multiples such as EV/EBITDA, EV/Revenue, and P/E are computed, and any outliers are identified and removed to ensure the results are accurate.
1. Size
Measures of overall company scale and market presence:
- Equity Value = Share Price × Shares Outstanding
- Enterprise Value (EV) = Equity Value + Net Debt
- EBITDA = Net Income + Taxes + Interest Expense + D&A or alternatively Operating income + D&A
- EBIT = Net Income + Interest Expense + Taxes
2. Profitability
These metrics help assess how efficiently a company converts revenue into profit at various stages of its income statement:
- EBITDA Margin = EBITDA / Revenue
- EBIT Margin = EBIT / Revenue
- Gross Margin = Gross Profit / Revenue
- Net Income Margin = Net Income / Revenue
3. Growth
Used to evaluate how quickly a company is expanding over time:
- Revenue Growth Rate (YoY or CAGR)
- EBITDA Growth Rate
- EPS Growth Rate
4. Returns & Capital Efficiency
Shows how effectively a company generates returns for shareholders and utilizes its assets:
- Return on Equity (ROE) = Net Income / Shareholders’ Equity
- Return on Assets (ROA) = Net Income / Total Assets
- Return on Invested Capital (ROIC) = EBIT / Net Debt + Equity
- Dividend Yield = Annual Dividends per Share / Share Price
Finally, investors may also assess a company’s credit profile to better understand the level of financial risk it is assuming. One of the most widely used metrics in this context is the Debt-to-EBITDA ratio, which measures a company’s ability to service its debt based on its operating cash flow. A higher ratio may indicate elevated leverage and potential strain on financial stability, while a lower ratio suggests more conservative debt levels and stronger creditworthiness. Credit rating agencies such as Moody’s, Fitch Ratings, and Standard & Poor’s (S&P) play a critical role in assessing the creditworthiness of companies, governments, and financial instruments. These agencies assign credit ratings that reflect the perceived risk of default, helping investors gauge the relative safety of investing in a company’s debt.
With the key statistics calculated investors can proceed with the calculation of financial multiples. The most relevant ones include a measure of market valuation in the numerator and a measure of financial performance in the denominator.
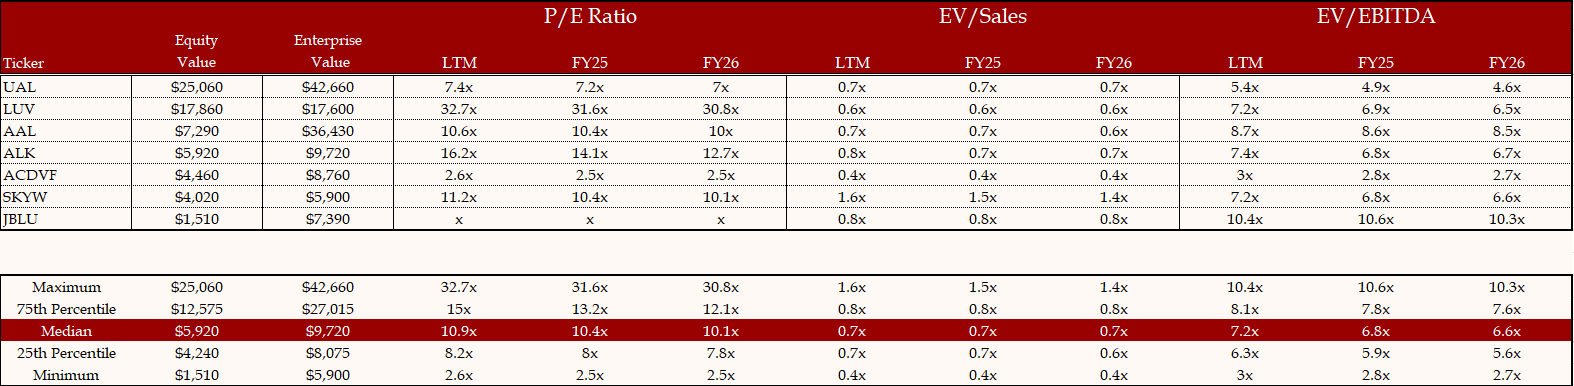
The key multiples investors look at are:
- P/E Ratio = Share Price / EPS
- EV / EBITDA
- EV / Sales
Step 4. Assess the valuation
Once calculated, the multiples are organized into a valuation range which includes the median as well as percentiles to create a more accurate range. This range forms the basis for estimating the target company’s value, allowing investors to identify whether thr company is trading at a premium or discount relative to its peers. Special attention is given to the closest comparables, which at the time of the calculations are given more weight.
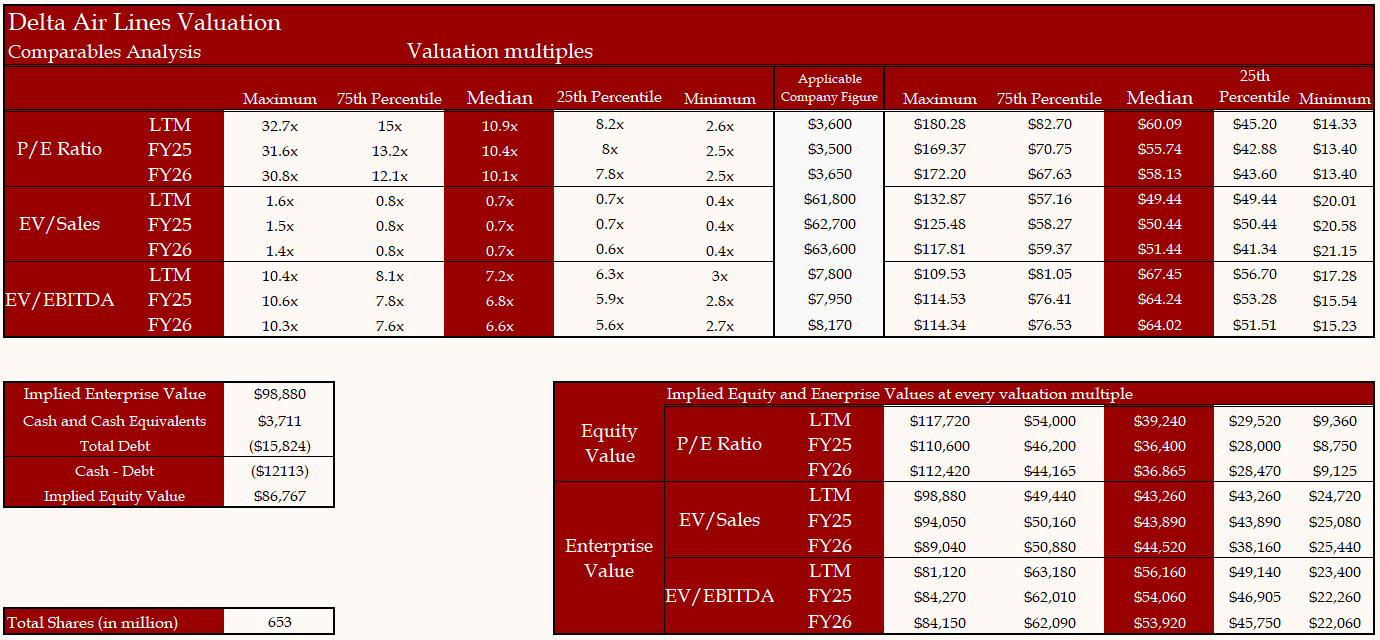
Based on our analysis, we estimate the fair value of Delta Air Lines to be $57.90, with an interquartile range of $48.25 to $66.60, representing the 25th and 75th percentiles of our valuation estimates. This means that on 07/01/2025, with Delta Air Lines trading at $49.90 the stock offers an upside potential of 16% following the Comps approach.